
ELECTION TOUCHSCREEN
Evolving a Real-Time Data Interface for Live Election Coverage
SUMMARY
Every election season, Fox News enhances its coverage with a touchscreen application that gets used on-air by the news anchors.
The app gives audiences a deeper dive into election data, and covers all races from national, to state, to county level. It has historical features, remaining votes to be counted, and delegate information for the primaries. It also contains a polls closing tracker, an election calendar section, and a rule book for understanding how primaries count delegates by state.
I led the visual and interaction evolution of a live touchscreen application used by broadcast anchors to navigate and present complex election data in real time.
The work focused on modernizing the interface while defining scalable interaction patterns and visual rules that could support expanding data sets and new features, all without increasing cognitive load during live broadcasts.
PROJECT OR FILE
Figma walkthrough is Available Upon Request
TECHNICAL SNAPSHOT
Data Type: Real-time, hierarchical election data (national → state → county)
Environment: Live broadcast, zero-latency tolerance, high-pressure usage
System Complexity: Multi-state UI, dynamic data updates, feature overlays
Design System: Component-based architecture in Figma (variants, reusable patterns)
Engineering Alignment: Production-ready Figma files used as in live rehearsals and as source of truth for build
The Result
Touchscreen in use during 2024 election night coverage.
THE CHALLENGE
SEEKING MODERNIZATION WITHIN TECHNOLOGICAL LIMITS
The election touchscreen operates in a uniquely demanding environment:
-
Real-time, high-stakes usage during live broadcasts
-
Dense, multi-level data (national → state → county)
-
Improvised interaction by anchors under time pressure
At the same time, we needed to:
-
Introduce new features and additional data
-
Modernize the visual language and interaction model
-
Work within existing technical constraints
-
Ensure the interface remained intuitive and low-friction

This is a still from 2016 election cycle coverage. There was less data on screen, navigation and buttons had previously been controlled by engineering, and the design was too constrained by perceived technical limitations.
APPROACH
ESTABLISHING A SCALABLE INTERACTION SYSTEM
Rather than redesigning individual screens, I focused on defining a cohesive interaction and visual system that could scale with the product’s growing complexity.
Design Principles
-
Speed over friction: minimize clicks and navigation depth
-
Clarity in motion: support fluid storytelling during live use
-
Consistency across views: unify interaction patterns across data types
-
Progressive complexity: allow deeper exploration without overwhelming the user

This annotated still demonstrates some of the most significant upgrades made to the touchscreen based on the principles listed above.
SYSTEM DESIGN
BOOSTING COHESION WHILE ELEVATING THE VISUAL DESIGN
The redesign introduced a more unified and scalable structure:
-
Standardized navigation patterns
Consistent interaction models across maps, data views, and feature sets -
Component-driven UI
Reusable elements for controls, filters, and data displays -
Simplified visual language
Reduced visual noise and unified styling to improve readability under pressure -
Structured information hierarchy
Organized complex data into predictable, navigable layers

This is a basic user flow demonstrating all the layers of data within one office race. The navigation would operate the same for any office race, and all features, such as "remaining vote" heat map overlay, would be available within the map for any office race. Some data, however, such as electoral vote overlay on the map, is only available in the presidential office mode.

I overhauled the navigation and menu UI to make it more consistent across the various areas of the touchscreen. These menus include a "raceboard" menu, which is a menu that would appear over any map-based data with candidate headshots, a polls closing times menu, a menu for the area of the touchscreen where an anchor can play a "what if" game, exploring various race outcomes at the national level, a calendar menu, and more.
A CLOSER LOOK AT THE FIGMA SYSTEM
CREATING A POWERFUL MULTI-PURPOSE PROTOTYPE
To support the complexity of the touchscreen and its real-time use in live broadcasts, I built a structured, component-based Figma system that functioned as both a production reference and as an interactive simulation tool.
-
Built reusable components using variants and shared styles to maintain consistency across views
-
Structured files to reflect real product logic, enabling efficient iteration and alignment with engineering
-
Organized assets to support rapid updates as election data evolved (e.g., candidate changes, color updates)
-
Delivered high-fidelity, production-aligned designs used by engineering as a build reference
In addition to handoff, the Figma prototype was used to simulate real on-air interactions:
-
I created interactive prototypes that allowed anchors to rehearse navigation and storytelling flows
-
It was used in live rehearsal environments to test usability under real-world conditions
-
It helped enable early validation of interaction patterns, timing, and information hierarchy before development.
These prototypes became a critical tool for testing the experience in realistic conditions, informing iterative refinements throughout the design process.

I built out the entire touchscreen application pixel perfect within the figma file for both primaries and the general election

This level of organization within our figma file helped us keep colors consistent, and also quickly update our prototypes as the races changed throughout the election cycle. When an asset is updated here, the colors and candidate headshot update everywhere they appear within the prototype.
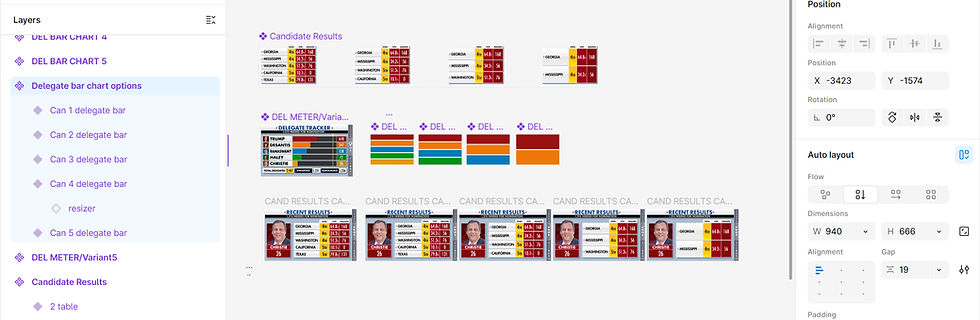
Leveraging auto-layout, I was able to create variants of components to accommodate an expected varying amount of data in tables and charts. Using tricks such as adding a "resizer" to bar charts allowed me to easily adjust details of the design for rehearsal purposes.
PROTOTYPING & VALIDATION
TESTING EARLY & OFTEN
Because the product is used live on air, validating usability was critical. The primary use of the touchscreen are broadcast anchors operating in high-pressure, real-time environments, requiring fast navigation and clear data storytelling.
I led iterative prototyping and testing across multiple stages:
-
Internal testing with low-fidelity wireframes
-
Recorded interaction sessions to evaluate usability
-
Early and ongoing testing with broadcast anchors
-
In-studio testing to simulate real-world conditions using the high-fidelity Figma prototype.
These sessions helped refine:
-
Interaction flow and navigation patterns
-
Element placement based on physical movement and reach
-
Timing and transitions during live segments
Low Fidelity Wireframes
This is an example of an early internal testing session we completed with initial wireframes for new data screens in the touchscreen app.


Moderated User Testing
Here is an example of one of many in-studio testing sessions with news anchor Bill Hemmer. This helped us test usability both from the user's perspective, and also from the viewer's perspective. In this testing session, we realized by reviewing the footage that the anchors often stand in front of the right side of the screen, which caused us to move some info on the screen and change blocking.

ROLE
I led the visual and interaction design for the touchscreen, including:
-
Defining interaction patterns and navigation structures
-
Establishing updated visual language across the interface
-
Designing new data views and features
-
Prototyping and testing with real users and scenarios
-
Collaborating with product, engineering, and broadcast teams
IMPACT
-
Improved usability for real-time, on-air data storytelling
-
Enabled the introduction of new features without increasing complexity
-
Established a more cohesive and modern visual language
-
Created scalable patterns to support future election cycles and feature growth
Finished Designs


