
HUDSON SQUARE STORYLINE PUBLIC ARTS GRANT
Translating Community Narratives into Structured Insight and Visual Storytelling
SUMMARY
I led a qualitative research initiative that captured community stories and translated them into structured frameworks and visual outputs.
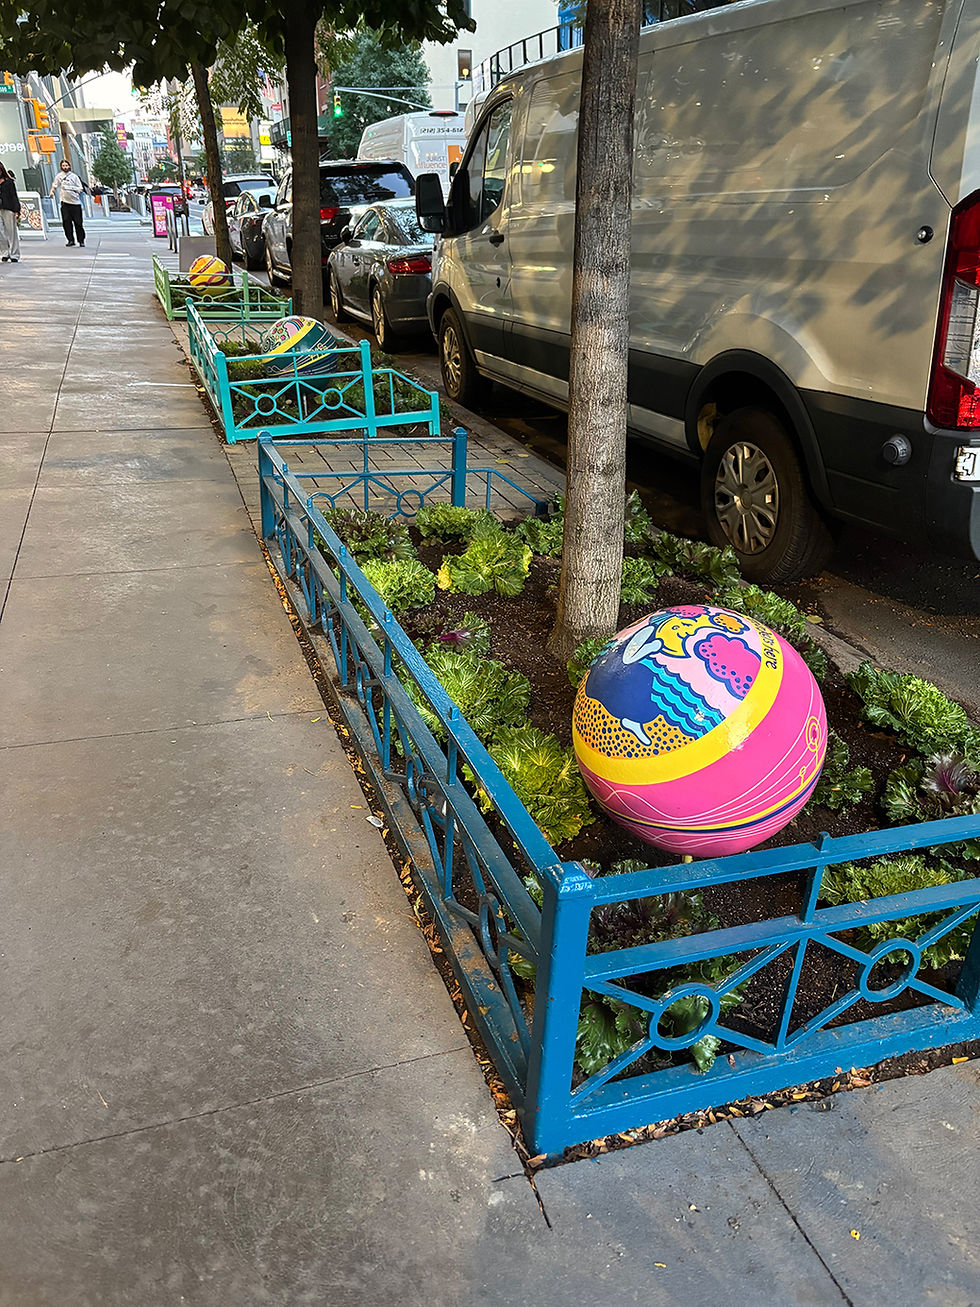
The project focused on identifying patterns across individual narratives, such as recurring roles, themes, and emotional arcs, and transforming unstructured input into systems that could be understood, explored, and shared through a year-long public art installation. The installation ultimately took the form of 20 18” hand-painted spheres placed throughout the treebeds of the community.
PROJECT OR FILE
The installation is along Spring and Washington Streets in Manhattan though fall 2026.
The Resulting Installation


CONTEXT
WHY DOES THIS PROJECT EXIST?
The goal of the grant was to engage the Hudson Square community and reflect back to them shared themes across their individual experiences.
Once a historic printing district, Hudson Square is now undergoing rapid transformation, with new businesses and development reshaping the neighborhood. This project aimed to capture a snapshot of what is going on right now culturally through personal storytelling.
Participants were asked to share a recent, memorable experience from their past week. The result was a collection of open-ended, highly varied stories that were rich in detail, but unstructured and subjective.

An image from the Hudson Square neighborhood (credit: W Architecture)
RESEARCH
COLLECTING AUDIO & HEARING THE COMMUNITY
Methodology
-
Conducted audio-recorded, facilitated storytelling sessions using open-ended prompts
-
Supplemented narratives with a small set of structured questions
-
Collected stories from 100+ participants
Data Characteristics
-
Unstructured and subjective
-
Emotionally driven
-
Mixed standardized and non-standardized inputs
-
No predefined taxonomy or categorization

This is a data collection storytelling session. Three facilitators worked together in a session; two accepted walk-up or pre-scheduled storytellers for 10-minute sessions, while one helped storytellers "string up" their story on the community story map.

A data collection session at historic neighborhood bar, Ear Inn.

A set of examples of the stories collected.
NARRATIVE DIMENSIONS
TURNING STORIES INTO ANALYZABLE COMPONENTS
To make sense of the dataset, I first did an initial analysis using structured inputs, (such as self-reported points like whether the storyteller changed or not as a result of the experience they shared), demographic information, and common themes of the stories.
Next, I applied narrative theory as a lens for analysis, using known story structures and archetypes to “test” different ways of organizing the data.
By working through sample sets of a few stories at a time, I evaluated which narrative dimensions revealed meaningful and repeatable patterns.
Some exploratory dimensions included:
-
character archetypes
-
emotional trajectories
-
narrative tension
-
significant objects and their symbolic function
-
internal vs external story drivers
-
perceived “epicness” or scale of the experience


Some initial breakdowns of the story data.
A spreadsheet where I kept track of the various narrative metrics I played out across the dataset of stories. Stories were systematically tagged across multiple dimensions, enabling pattern identification and cross-story analysis.
VISUAL FRAMEWORK DEVELOPMENT
USING VISUAL STRUCTURE TO GUIDE ANALYSIS
Before fully formalizing the analytical system, I made an early structural decision that shaped the rest of the project:
The installation would be divided into two primary categories of spheres -
-
Character Role spheres
-
Story Lesson spheres
This decision created two distinct frameworks for organizing and interpreting the stories. We also had already established that each sphere would have space for both a representational image, and data visualization, so establishing these frameworks early on allowed hired artists to begin their part of the process creating representative illustrations, while I continued analysis of the data. Here is a more detailed breakdown the categories:
Character Role Spheres
These spheres represented the most common roles participants played within their own narratives, including:
-
Adventurer
-
Thinker
-
Creator
-
Collaborator
-
Peacemaker
-
Visionary
-
Witness
-
Influencer
Story Lesson Spheres
These spheres represented the most common recurring lessons conveyed across stories, including:
-
Challenges are overcome through perseverance & a little help from friends
-
Adventurous spirits find confidence & clarity
-
Bringing people together rekindles our collective faith in humanity
-
Ordinary events often have significant impacts
-
Compassion & kindness are all around us, even when we least expect it
-
How we react to elements out of our control reveals our innermost selves
-
Substantial goals are achieved through consistent, small actions
-
Honoring friends and family is an opportunity as well as a responsibility
Establishing these two systems early helped define:
-
which metrics were worth tracking
-
which relationships mattered most
-
how audiences would navigate the installation physically and conceptually
-
how stories would ultimately be visualized; it was enough direction for hired artists to begin concepting the representative illustrations that would appear on each sphere with the data viz.

Here is the general structure and breakdown of a sphere. It was established early in the process that a representative illustration would appear on a portion of each sphere, and another portion would have data visualization. This diagram also shows a 24" steel pole that was attached to each sphere that would help install it into the ground.


These are the final representative illustrations that were hand-painted onto each sphere alongside data visualizations. This process began as data visualization systems were still being established.
ITERATIVE ANALYSIS & VISUAL EXPLORATION
DEVELOPING THE METRICS THROUGH DESIGN
The analytical process and data visualization process evolved simultaneously.
As stories were tagged and categorized within spreadsheets, I also began sketching visual structures and testing how different combinations of metrics behaved visually across small sets of data.
These activities were deeply interconnected:
-
extracting narrative dimensions influenced the visual systems
-
sketching visual systems influenced which dimensions proved meaningful
Rather than following a linear “analyze first, design later” process, the framework emerged iteratively through ongoing movement between:
-
qualitative interpretation
-
structured tagging
-
spreadsheet analysis
-
exploratory sketching
-
visual testing
Through this process, certain dimensions consistently revealed stronger patterns than others.
For the Character Role spheres, the most meaningful dimensions became:
-
internal vs external story drivers
-
perceived impact or “epicness”
-
whether the storyteller changed as a result of the experience
-
relationships between role type and transformation
These visualizations also represented individual stories directly. Each plotted point corresponded to a specific participant narrative.
For the Story Lesson spheres, the most meaningful dimensions became:
-
tonal shifts across stories
-
relationships between lessons and character roles
-
broader patterns emerging across groups of narratives
Unlike the character spheres, these visualizations emphasized aggregate trends rather than individual stories.
This process ultimately established the information architecture for the entire installation.


The Data Visualization Systems


SPATIAL NAVIGATION
HOW TO NAVIGATE THE SPHERE SYSTEM
To create a cohesive physical experience:
-
Character role spheres were placed along one street
-
Story lesson spheres were placed along another
-
Additional navigation markers guided visitors through the installation
Hand-lettered text and visual cues were incorporated to provide context and orientation without overwhelming the experience.


CONSTRAINTS
-
Ambiguity and variability of qualitative data
-
No predefined structure or taxonomy
-
Need to balance interpretation with authenticity of individual stories
-
Physical and environmental constraints of a public installation
-
Coordination across a large, multidisciplinary team
ROLE
-
Designed and led the research initiative
-
Developed data collection methodology and facilitated storytelling sessions
-
Hired, trained, and managed a team of story collectors
-
Defined the analytical framework and synthesis process
-
Designed data visualizations and overall system structure
-
Art directed all illustrations and visual outputs
-
Led production, coordinating a team of ~15 creatives including illustrators, assistants, and lettering artists

IMPACT
-
Revealed shared patterns across diverse community narratives
-
Transformed abstract, personal experiences into structured and explorable insights
-
Enabled audiences to see connections between individual stories
-
Created a reusable framework for analyzing and communicating qualitative data
-
Delivered a large-scale public installation that engaged a broad audience over time
Finished Illustrations

